
Post-Op Follow-Up Schedule That Prevents Prosthetic Delays (For Clinicians)
For many clinicians, the surgery is only the first step. What happens after the operation


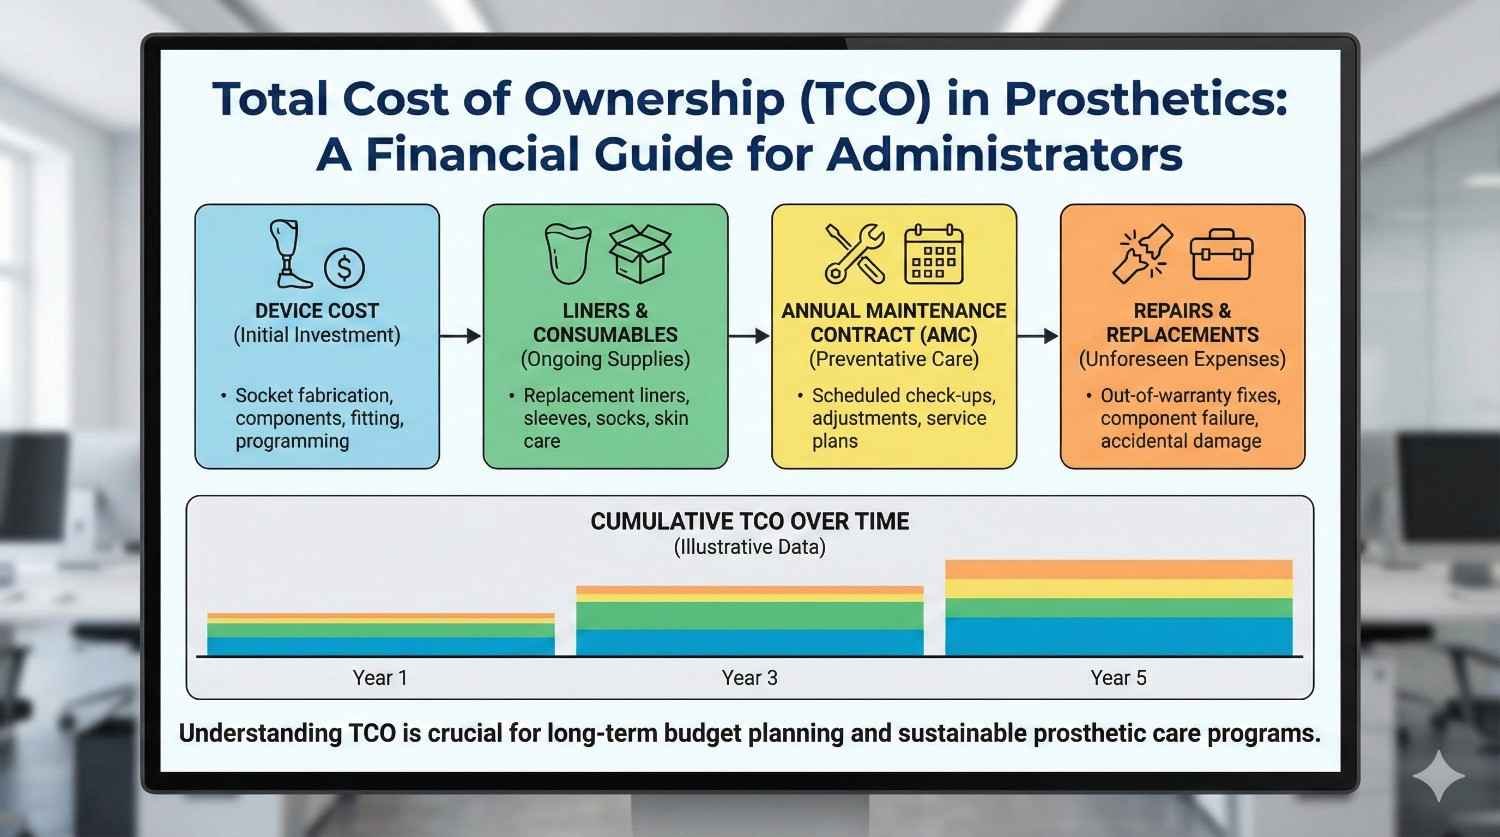
When hospitals and prosthetic programs look at costs, they often see only the device price. That number feels clear, fixed, and easy to compare. But in real life, prosthetics do not behave like one-time purchases. They behave like long-term systems with ongoing expenses, hidden drains, and decisions that quietly shape budgets year after year.
This article is written for hospital administrators, procurement heads, and program managers who want control, not surprises. We will break down the total cost of ownership in prosthetics in very simple terms. This includes the device, liners, annual maintenance contracts, repairs, downtime, and indirect costs that rarely appear in spreadsheets. The goal is to help you budget better, negotiate smarter, and build prosthetic programs that stay financially stable over time.
Most prosthetic budgets begin and end with the device invoice.
This creates a false sense of control because many important costs arrive later and in smaller pieces.
Over time, these smaller expenses add up and often exceed the original device cost.
Total cost of ownership brings these hidden layers into view.
A prosthetic device is used every day for years, not weeks.
It interacts with the human body, the environment, and the hospital system continuously.
Wear, tear, adjustments, and replacements are natural outcomes of this use.
TCO helps admins plan for this reality instead of reacting to it.
The first year often feels manageable because the focus is on fitting and discharge.
Problems usually surface in the second and third years through liner replacements, repairs, and service needs.
These costs often sit outside the original budget approval.
TCO planning prevents this cycle of surprise and justification.
The device is only the starting point in the ownership journey.
Every prosthesis relies on consumables, services, and follow-up care to stay usable.
Ignoring these elements creates incomplete cost projections.
TCO captures the full picture from day one.
Costs in prosthetics are spread across time.
What looks affordable in year one may become expensive by year five.
TCO forces admins to ask how costs behave over the full life of the device.
This time-based view improves long-term planning.
A prosthesis may be owned by the hospital or patient, but its use defines cost.
High-use devices need more maintenance and consumables.
Low-use devices risk abandonment, which is also a cost failure.
TCO considers both extremes.
The prosthetic device forms the base of total cost.
This includes sockets, joints, feet or hands, and control systems.
Prices vary widely based on technology level and customization.
However, this base layer rarely reflects final spend.
Liners are consumables that sit between the limb and the socket.
They wear out due to sweat, friction, and daily use.
Most users need multiple liner replacements each year.
These recurring costs are often underestimated in budgets.
Suspension systems such as sleeves, belts, or locks also wear over time.
Poor suspension increases discomfort and repair needs.
Regular replacement is part of healthy prosthetic use.
TCO models must include these cycles.
Liners absorb sweat and body oils every day.
They stretch, thin out, and lose grip over time.
As liners degrade, fit quality drops and skin issues increase.
Replacement becomes unavoidable for safe use.
Most active users need liner replacement every three to six months.
Less active users may extend this slightly, but not indefinitely.
Delaying replacement often leads to higher medical and repair costs later.
Predictable planning is cheaper than reactive spending.
Basic liners cost less but may wear faster.
Advanced liners cost more but often last longer and reduce skin issues.
Choosing purely on price can increase long-term spend.
Admins should compare cost per month, not per unit.
Annual maintenance contracts usually cover routine servicing and minor repairs.
They may include inspections, adjustments, and basic part replacements.
AMCs provide cost predictability and reduce emergency spending.
However, coverage details vary widely.
Many AMCs exclude consumables like liners and sleeves.
Major component failures may also be excluded or capped.
Admins should read AMC terms carefully before assuming full coverage.
Misunderstood AMCs lead to budget overruns.
AMCs are most useful for advanced or high-use prosthetic devices.
They smooth out costs and reduce downtime.
For low-use devices, ad hoc repairs may be cheaper.
Matching AMC choice to usage pattern improves TCO.
Prosthetic devices operate in tough conditions.
Dust, moisture, impact, and daily stress cause wear.
Even well-made devices need occasional repair.
Ignoring this reality leads to poor budgeting.
These include parts, labor, and service charges.
Costs vary based on device complexity and availability of spares.
Imported components often cost more and take longer to source.
Downtime adds hidden cost.
When a device is under repair, the user may need extra care.
Hospital visits increase and rehab progress may stall.
Staff time and patient dissatisfaction also rise.
These indirect costs matter in TCO thinking.
Downtime is the period when the prosthesis is not usable.
This can be due to repair delays, part shortages, or service gaps.
During downtime, functional independence drops sharply.
This has both human and financial impact.
Patients may return to the hospital for support.
Rehab schedules get disrupted and staff time increases.
Emergency fittings or temporary solutions add cost.
Downtime is rarely free.
Local service support reduces repair delays.
Spare availability and clear service agreements matter.
Admins who plan for uptime reduce long-term cost.
Service quality directly affects TCO.

Imported devices often rely on international supply chains.
Delays due to shipping or customs increase downtime.
Local devices usually have faster spare access.
Time savings translate into cost savings.
Local service teams are easier to reach and schedule.
This reduces travel and coordination costs.
Faster resolution prevents small issues from becoming major repairs.
Service proximity is a TCO advantage.
Imported prices may fluctuate with currency changes.
Local pricing is often more stable.
This predictability helps long-term budgeting.
Admins should factor this into ownership decisions.
Active users stress components more heavily.
They need more frequent liner changes and adjustments.
Their TCO is higher but so is functional benefit.
Planning prevents cost shocks.
These users may need fewer replacements.
However, poor fit tolerance can increase medical visits.
Comfort-focused choices often reduce indirect costs.
TCO is not always lower just because activity is low.
Children outgrow sockets quickly.
Frequent refits and replacements are unavoidable.
TCO planning is essential in pediatric programs.
Short-term savings rarely work here.
TCO allows fair comparison across suppliers.
A cheaper device with high service cost may be more expensive overall.
Admins should ask vendors for multi-year cost estimates.
This shifts negotiations to value, not discounts.
Including liners, AMC, and repairs upfront reduces mid-year budget stress.
Finance teams appreciate predictable spend.
Programs run more smoothly with fewer approvals.
TCO supports operational calm.
Clear TCO logic helps justify spending decisions.
Auditors prefer long-term thinking over reactive fixes.
Documentation improves trust and approval speed.
Transparency protects admins.
Most prosthetic budgets are planned on a one-year cycle because that is how hospital finances operate.
Prosthetic ownership, however, rarely fits neatly into a single year.
Devices continue to generate costs long after the initial fitting, often in small but frequent amounts.
Looking only at year one hides the true financial behavior of the program.
In the first year, the largest expense is the device and initial fitting.
In the second year, liner replacements, minor repairs, and service visits become more visible.
By the third year, component wear, suspension changes, and occasional major repairs appear.
A three-year view already tells a very different cost story than a one-year view.
Many prosthetic components are designed to last four to five years with proper care.
This makes five years a practical horizon for ownership planning.
Over this period, consumables and service costs often equal or exceed the device cost.
Admins who plan five years ahead avoid repeated approval cycles and budget shocks.
The hospital incurs the device cost, fitting charges, and initial rehab coordination.
Liner usage is high as patients adapt, leading to early replacements.
Service needs are mostly adjustments rather than repairs.
Costs feel front-loaded but still predictable.
By the second year, daily use becomes consistent.
Liner replacement becomes the most frequent expense.
Small repairs, alignment checks, and suspension changes appear.
These costs are often spread out and easy to miss without tracking.
Component wear becomes more evident over time.
Some users need major part replacements or socket refits.
At this stage, admins often face decisions about upgrades or continued repair.
Good TCO planning makes these decisions calm rather than urgent.

Upper-limb prosthetics often have lower liner costs but higher component sensitivity.
Myoelectric systems include batteries, electronics, and control units.
Body-powered systems have lower electronics cost but higher harness wear.
Each category creates a different ownership curve.
Rechargeable batteries degrade over time.
Most need replacement every one to two years.
These costs are often forgotten during procurement discussions.
Including them early improves forecast accuracy.
Cables, gloves, and cosmetic covers wear with use.
These parts are replaced more often than major components.
Individually they seem minor, but together they add up.
TCO captures these cumulative effects.
Vendors are used to negotiating on unit price.
Admins who introduce TCO change the dynamic.
Instead of asking for discounts, they ask for cost stability over time.
This often leads to more meaningful concessions.
Admins should ask how often liners typically need replacement.
They should ask which parts fail most often and what repairs cost.
They should also ask about service response time and spare availability.
These questions reveal real ownership cost.
Two devices may look similar in price and function.
However, one may have higher liner costs or slower service.
A simple TCO comparison over three years often reveals the better choice.
Admins should document this comparison for internal approvals.
Lowest price procurement often leads to higher long-term spend.
Hospitals can revise policies to include ownership cost as a criterion.
This encourages vendors to compete on service and durability.
Quality improves when policies reward value.
Using too many liner or accessory types increases complexity.
Standardization simplifies inventory and reduces waste.
Bulk purchasing also improves pricing.
Admins can use TCO logic to justify standardization.
Clinical preferences affect TCO outcomes.
Procurement teams should involve clinicians in TCO discussions.
When both sides understand trade-offs, decisions improve.
Alignment reduces conflict and rework.
Liners and sleeves follow predictable replacement cycles.
Hospitals can forecast demand based on active patient numbers.
This reduces emergency purchases and stock-outs.
Predictability lowers cost and stress.
Overstocking consumables ties up capital.
Some materials degrade or expire if unused.
TCO planning helps balance availability with efficiency.
Right-sized inventory supports cash flow.
When service visits are planned, consumable needs can be aligned.
This coordination reduces repeat visits and shipping costs.
Operational efficiency improves.
Admins benefit from integrated planning.
Not all AMCs are good or bad by default.
Their value depends on device complexity and usage.
Admins should compare AMC cost against expected repair spend.
This comparison clarifies whether an AMC makes sense.
Many AMCs exclude key items by default.
Admins can negotiate inclusion of common repairs or priority service.
Clear scope reduces dispute and surprise.
Well-designed AMCs improve uptime.
AMCs should not be set and forgotten.
Admins should review usage, response times, and outcomes yearly.
Poorly performing contracts should be renegotiated or discontinued.
Active management protects TCO.

Every day of downtime increases indirect costs.
Patients return for help, rehab slows, and dissatisfaction rises.
Faster repair resolution reduces these knock-on effects.
Admins should value speed, not just price.
Service response time should be written into agreements.
Clear timelines reduce ambiguity.
Local support should be prioritized where possible.
Service access is a financial lever.
Some programs maintain backup components or temporary solutions.
This reduces disruption during repairs.
While it adds small upfront cost, it saves larger indirect costs.
TCO thinking supports these decisions.
Finance teams prefer structured, forward-looking explanations.
TCO data shows that spending is planned, not accidental.
This improves audit outcomes.
Admins gain credibility.
Leadership often sees rising costs without context.
TCO allows admins to explain why costs rise and where they stabilize.
Context reduces alarm and builds trust.
Transparency strengthens support.
As TCO data accumulates, forecasts improve.
Variance reduces over time.
Budgets become more reliable.
This stability benefits the entire hospital.
The most important shift an administrator can make is moving from a buyer mindset to an owner mindset.
Buying focuses on price and approval, while ownership focuses on performance, upkeep, and long-term stability.
When prosthetics are treated as owned systems rather than purchased items, cost control improves naturally.
This shift alone prevents many avoidable budget issues.
TCO should not live only in annual budget meetings.
It should inform vendor selection, service contracts, inventory planning, and even clinical discussions.
When admins ask how a decision affects ownership cost over time, better choices follow.
Consistency in this lens builds financial discipline across teams.
Before approving any prosthetic purchase, clarify how long the device is expected to remain in use.
This includes realistic usage based on patient profile, not brochure claims.
Life expectancy sets the timeline for all other cost planning.
Without this step, TCO estimates remain vague.
Identify liners, sleeves, gloves, batteries, cables, and cosmetic covers linked to the device.
Estimate how often each item needs replacement under normal use.
Multiply this by expected years of use to reveal the real consumable cost.
This exercise alone often surprises finance teams.
Review typical repair patterns for the device category.
Include routine adjustments, common failures, and major part replacements.
Use real-world data where possible instead of theoretical durability.
Service patterns shape both cost and downtime.
Compare AMC cost against expected repair and service spend.
Include response time, spare availability, and coverage limits.
Choose the option that provides better predictability, not just lower headline cost.
Re-evaluate this choice annually.
Estimate what happens when a device is unavailable.
Include extra visits, rehab delays, and staff time.
Even rough estimates improve decision quality.
Downtime is often the hidden cost driver.
When comparing two prosthetic options, place them side by side across five years.
Include device cost, consumables, AMC or repairs, and expected downtime.
Avoid mixing one-time and recurring costs in the same column.
Clarity matters more than precision.
Devices that look cheaper upfront often show higher long-term cost.
Conversely, higher-priced devices sometimes stabilize spending over time.
Seeing the full picture reduces emotional decision-making.
Admins gain confidence in approvals.
Hospitals should formally include ownership cost in procurement criteria.
This can be done without complex scoring systems.
Even a basic three-year TCO estimate improves outcomes.
Policy change reinforces good habits.
Vendors respond to what hospitals ask for.
When admins ask about liners, service frequency, and downtime, transparency improves.
This pushes the market toward better long-term solutions.
Informed buyers shape better offerings.
Too much variation increases inventory, training, and service costs.
Standardization around a few proven systems reduces ownership complexity.
TCO logic provides a strong justification for this move.
Consistency saves money quietly.

Clinicians focus on outcomes and patient comfort.
Admins focus on budgets and sustainability.
TCO bridges this gap by showing how comfort, fit, and service affect cost.
Shared understanding reduces friction.
Finance teams value predictability and documentation.
TCO provides both.
It explains why costs exist and how they are planned.
This improves audit confidence and reduces scrutiny stress.
As people change roles, TCO knowledge can be lost.
Hospitals should document their ownership assumptions and update them regularly.
This continuity protects long-term planning.
Institutional memory matters.
Ownership cost changes as usage patterns change.
Static models become outdated quickly.
Regular review keeps TCO relevant.
Living models outperform fixed ones.
Planning for every extreme can paralyze decisions.
Use realistic averages with sensible buffers.
Balance caution with practicality.
Good planning is calm, not fearful.
Discomfort, skin issues, and frustration increase service use.
Better patient experience often lowers ownership cost.
Admins should listen to clinical feedback closely.
Human outcomes affect financial outcomes.
Total cost of ownership is not about spending less at any cost.
It is about spending wisely, predictably, and with foresight.
Prosthetic programs succeed when costs are understood, planned, and aligned with real use.
TCO brings structure to what often feels unpredictable.
At RoboBionics, we work closely with hospitals across India and see how TCO thinking changes outcomes.
Programs that plan ownership carefully face fewer crises, make better vendor choices, and deliver more stable care to patients.
The most resilient prosthetic programs are not the cheapest ones, but the ones with the clearest understanding of what ownership truly means.
For many clinicians, the surgery is only the first step. What happens after the operation

For trauma amputees, the journey does not begin at the prosthetic clinic. It begins much

Amputation after cancer is not just a surgical event. It is the end of one

When a child loses a limb, the challenge is never only physical. A child’s body